������������ Overview
| Study Period | 2019 - 2030 |
| Base Year For Estimation | 2024 |
| Forecast Data Period | 2025 - 2030 |
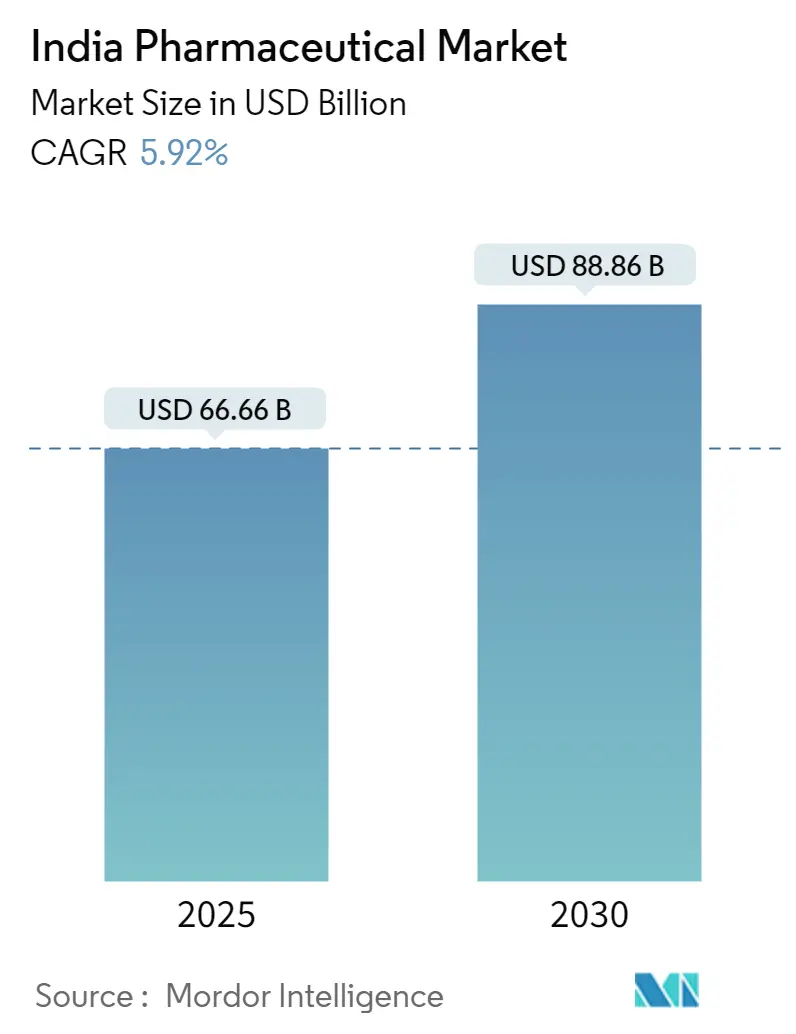
| ������������ Size (2025) | USD 66.66 Billion |
| ������������ Size (2030) | USD 88.86 Billion |
| Growth Rate (2025 - 2030) | 5.92% CAGR |
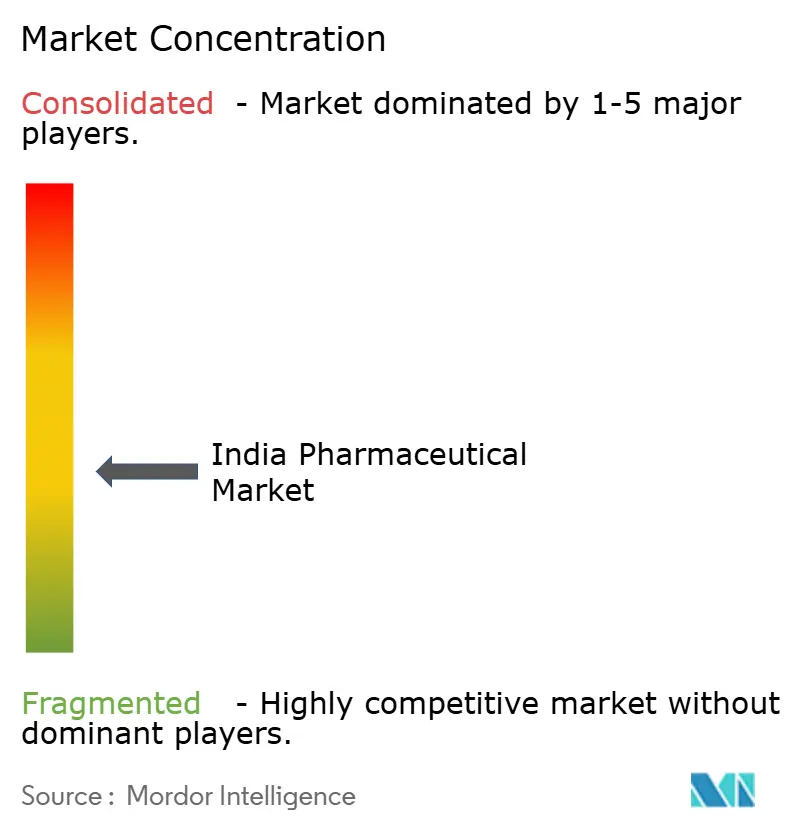
| ������������ Concentration | Medium |
Major Players
*Disclaimer: Major Players sorted in no particular order Image © Mordor Intelligence. Reuse requires attribution under CC BY 4.0. |
|
India Pharmaceutical ������������ Analysis by Mordor Intelligence
India pharmaceutical ������������ stands at USD 66.66 billion in 2025 and is forecast to reach USD 88.86 billion by 2030, advancing at a 5.92% CAGR. Chronic diseases, policy incentives and steady export demand give the ������������ a balanced twin-engine of domestic consumption and international sales. Government Production Linked Incentive (PLI) funds, wider health-insurance coverage and fast digital adoption continue to lift volume while nudging the competitive mix toward higher-value specialty drugs. Online channels are expanding fastest, but the retail network of roughly 850,000 pharmacies still anchors distribution. The shift from acute to chronic therapies, coupled with rising contract manufacturing for global innovators, keeps investment flowing into sterile injectables, advanced formulations and large-scale API plants.
Key Report Takeaways
�� By therapeutic category, Anti-Infectives led with 19.6% India pharmaceutical ������������ share in 2024, while Oncology is projected to grow at a 7.10% CAGR through 2030.
�� By drug type, Generic Prescription drugs accounted for 69% of the India pharmaceutical ������������ size in 2024; OTC medicines are forecast to expand at a 6.70% CAGR to 2030.
�� By route of administration, the Oral segment held 62% of the ������������ in 2024; Parenteral products are set to rise at a 6.90% CAGR between 2025-2030.
�� By formulation, Tablets & Capsules remained dominant at 56% share in 2024, while Injectables post the quickest 6.50% CAGR outlook.
�� By distribution channel, Retail Pharmacies retained 75% share in 2024; Online Pharmacies are advancing at a 7.30% CAGR to 2030.
�� By geography, North India captured 33% of the India pharmaceutical ������������ size in 2024; Northeast India is growing the fastest at a 6.40% CAGR through 2030.
India Pharmaceutical ������������ Trends and Insights
Driver Impact Analysis
| Driver | ( ~ ) % Impact on CAGR Forecast | Geographic Relevance | Impact Timeline |
|---|---|---|---|
| Government PLI Schemes Accelerating API Self-Reliance | +1.2% | Gujarat, Maharashtra, Telangana | Medium term (2-4 years |
| Expansion of Health Insurance Penetration in Tier-2/3 Cities | +0.9% | Emerging urban centers nationwide | Long term (��4 years) |
| Burgeoning Demand for Chronic-Care Drugs Amid Ageing Population | +1.1% | South and West India | Long term (��4 years) |
| Low-Cost Manufacturing & Skilled Chemistry Talent Pool | +0.8% | Major manufacturing clusters | Medium term (2-4 years) |
| Surge in CDMO Outsourcing to India by Global Innovators | +0.7% | Maharashtra, Karnataka, Telangana | Medium term (2-4 years) |
| Fast-growing E-Pharmacy Adoption Enabling Wider Access | 0.6% | Urban India, expanding to Tier-2/3 | Short term (��2 years) |
Source: Mordor Intelligence
Government PLI Schemes Accelerating API Self-Reliance
PLI funding rose to INR 2,444.93 crore for 2025-26, targeting 11 bulk-drug lines and drawing cumulative investment pledges topping INR 1.46 lakh crore[1]Press Information Bureau, “PLI Scheme for Pharmaceuticals Receives Higher Outlay,�� pib.gov.in. Manufacturers in Gujarat, Maharashtra and Telangana are using the incentive to add fermenters and continuous-processing lines that could cut Chinese API dependence, currently 80% of import volume. Early beneficiaries report shorter lead times on macrolide antibiotics and corticosteroid intermediates, boosting supply chain resilience. As greenfield projects cross validation stages in 2027-2028, domestic API output should narrow cost gaps and add pricing power for finished formulations sold in the India pharmaceutical ������������. A successful import-substitution cycle also cushions foreign-exchange risk on input bills.
Expansion of Health Insurance Penetration in Tier-2/3 Cities
Only 35% of Indians carry health insurance, but payor mix is shifting as schemes such as Ayushman Bharat and private plans like Tata AIG’s MediCare Select add hospitals in emerging cities. Cash-less coverage reduces out-of-pocket hurdles, letting more households fill chronic prescriptions monthly instead of rationing doses. Claims data already show 30-40% higher medicine uptake among newly insured patients, especially for diabetes and cardiovascular care. The insurance wave feeds predictable demand into the India pharmaceutical ������������, enabling companies to launch adherence programs and smaller pack sizes tailored to semi-urban buying power. As network hospitals cross 14,000 in 2027, formulary-listed brands in chronic therapy should win durable volumes.
Burgeoning Demand for Chronic-Care Drugs Amid Ageing Population
Chronic drugs expanded 9.9% in January 2025 against overall ������������ growth of 8.4%, powered by surging cardiac (10.7%) and anti-diabetic lines. India’s 60-plus cohort will double to 19% of the population by 2050, turning maintenance therapy into a structural growth lever. Companies are adding fixed-dose combinations, once-weekly injectables and patient-education apps to build stickier product franchises. The dynamic is most visible in metro clinics across South and West India, where earlier screening lifts diagnosis rates. Retailers report higher refill frequency and lower abandonment for lipid-lowering and anti-hypertensive drugs, reinforcing the chronic-care pivot within the India pharmaceutical ������������.
Low-Cost Manufacturing & Skilled Chemistry Talent Pool
Operating expenses in Indian plants run 20-30% below peer sites in China, helped by efficient labor and power tariffs. More than 10,000 facilities hold GMP or WHO pre-qualification, and fresh graduates from NIPER campuses feed process-chemistry benches with specialized talent. Firms now deploy continuous-manufacturing skids and high-potency suites to climb up the value chain into complex generics. Rising sophistication underpins India’s role as a secondary supply hub for multinational pipelines, giving the India pharmaceutical ������������ steady technology inflows and quality upgrades. Government R&D credits amplify this cycle by easing the cash cost of pilot-scale innovation.
Surge in CDMO Outsourcing to India by Global Innovators
Contract development and manufacturing services generate USD 15.63 billion today and look set to triple by 2029. The Innovative Pharmaceutical Services Organization (IPSO) created in March 2025 maps standards for quality, data integrity and digital tech transfer, a move welcomed by US and EU sponsors. Hybrid models, such as Shilpa Medicare’s development-plus-manufacturing platform, accelerate molecule progression from laboratory to commercial batches. Over USD 7 billion already funnels into global capability centers handling discovery analytics, clinical biostatistics and regulatory affairs. These shifts fold additional high-value orders into the India pharmaceutical ������������ and deepen local skills in biologics, ADCs and peptide APIs.
Fast-growing E-Pharmacy Adoption Enabling Wider Access
E-pharmacies grow 7.3% a year, thanks to easy ordering, flat-fee home delivery and bundled tele-consult services. Pandemic-era trial converted millions of chronic-care users who now prefer doorstep refills with digital payment discounts. Platforms deploy algorithmic checks and NABL-approved warehouses to curb counterfeit risk, though regulators still weigh a nationwide e-pharmacy code. In smaller towns, tie-ups with kirana stores serve as pick-up points, stretching reach beyond courier lanes. The expanding digital layer lifts transparency in the India pharmaceutical ������������ and puts real-time price data within consumer view, nudging brick-and-mortar outlets to sharpen service.
Restraint Impact Analysis
| Restraint | ( ~ ) % Impact on CAGR Forecast | Geographic Relevance | Impact Timeline |
|---|---|---|---|
| Drug-Price Controls under NLEM Compressing Margins | -0.8% | National | Medium term (2-4 years |
| Regulatory Approval Delays for Novel Molecules | -0.6% | National | Medium term (2-4 years |
| High Dependence on Chinese APIs for Complex Molecules | -0.5% | National | Short term (��2 years) |
| Rising Quality-Compliance Costs (US-FDA, EMA) | -0.6% | National | Short term (��2 years) |
Source: Mordor Intelligence
Drug-Price Controls under NLEM Compressing Margins
The NPPA ceiling caps on 384 essential drugs slice profitability, forcing some brands below breakeven [2]World Health Organization, “Drug Price Control Order and Essential Medicines,�� iris.who.int. Violations flagged on 307 items underline compliance friction and sporadic stock-outs when firms exit loss-making lines. Although policymakers intend affordability, evidence shows restricted availability in rural clinics that rely on low-margin wholesalers. Companies hedge by tilting launches toward non-scheduled therapies or differentiated strengths outside NLEM scope, but that shift narrows treatment choice for price-sensitive patients. The India pharmaceutical ������������ thus faces a margin-versus-access tension that shapes investment decisions in mature therapeutic classes.
Regulatory Approval Delays for Novel Molecules
Revised Schedule M GMP rules demand workflow upgrades within six to twelve months, a tight window for small and medium manufacturers. Layered with lengthy ethics and stability-data reviews, the pathway from IND filing to final license remains unpredictable. Global CDMOs pair with regulatory consultancies, as in the Recipharm-ProductLife pact, to smooth submissions, yet domestic biotech start-ups still cite timeline drift as a funding drag. Slower clearances deter risk capital for first-in-class assets, potentially holding back innovation that could diversify the India pharmaceutical ������������ beyond generics.
High Dependence on Chinese APIs for Complex Molecules
Roughly 80% of India’s bulk-drug imports come from China, a vulnerability laid bare during pandemic border bottlenecks. Costs of key inputs like fermentative statins and cephalosporins spiked double-digit, squeezing working capital. The reopened PLI window starts to plug the gap, but technology transfer, environmental clearances and effluent-treatment investments stretch gestation periods. Until domestic plants hit commercial scale, manufacturers hedge by dual-sourcing or keeping six-month safety stock, a practice that locks cash and inflates carrying cost in the India pharmaceutical ������������.
Segment Analysis
By Therapeutic Category: Chronic-Care Momentum Shapes Portfolio Mix
The therapeutic slate shows Anti-Infectives holding 19.6% India pharmaceutical ������������ share in 2024, underscoring the lingering load of communicable diseases. Oncology however records the quickest 7.10% CAGR outlook, pushed by growing screening and expanded reimbursement for targeted therapies. Cardiovascular lines grew 10.7% in early 2025, making them the largest chronic pocket by value. Gastrointestinal drugs climbed 10.9% on back of proton-pump inhibitor combinations, whereas anti-diabetic scripts continued a steep 6.9% rise as lifestyle shifts bite.
Developers now allocate greater detailing budgets to chronic specialities, balancing mass-volume acute franchises with higher lifetime-value regimens. Patient-support helplines and mobile adherence tools have become standard in diabetes and cardiology ������������ing. Vaccines and ophthalmology, after pandemic highs, declined 12.8% and 8.6% respectively, prompting producers to rationalize SKU counts. The chronic swing reshapes site-of-care segmentation inside the India pharmaceutical ������������, pushing hospital sales ratios upward in oncology and dial-back clinics.

Note: Segment shares of all individual segments available upon report purchase
By Drug Type: Generics Core, OTC Ascendant
Generic prescriptions dominated 69% of the India pharmaceutical ������������ size during 2024, powered by branded generics that capture 87% of prescription value. Price-elastic demand and pervasive physician familiarity keep the segment resilient even under price caps. At the same time OTC lines are projected to clock a 6.70% CAGR through 2030, driven by self-care, advertising and easy digital buying.
Major firms now run twin engines: specialist-rep-driven branded generics for clinics and brand-equity-laden OTC packs for chemist shelves and e-carts. With pharmacists increasingly recommending switch categories such as analgesics and gastro protectants, OTC revenues provide a hedge against tighter NLEM margins. Online channels bundle OTC items with chronic drug refills, lifting basket values inside the India pharmaceutical ������������.
By Route of Administration: Parenteral Upswing Highlights Capability Gains
Oral dosage forms still command 62.0% of 2024 sales, reflecting cost merit and patient comfort. Yet parenteral lines are registering a 6.90% CAGR to 2030, the fastest within administration routes. January 2025 posted a 35.9% jump in injectable demand, echoing rising biologic and long-acting depot therapies.
Sterile fill-finish suites and lyophilization units are expansion priorities for both domestic and MNC plants. Cold-chain networks upgrade in parallel, especially for oncology and endocrinology vials. Inhalation and transdermal routes remain niche but gain traction via device innovation, promising future stickiness for differentiated delivery in the India pharmaceutical ������������.
By Formulation: Injectables Take Innovation Lead
Tablets and capsules held 56% of formulations in 2024, supported by high-speed compression lines and mature excipient supply. Injectables, forecast to grow at 6.50% CAGR, attract disproportionate capex into pre-filled syringes, liposomal suspensions and microsphere depots. Dermatology-linked creams and ointments rise in lock-step with consumer-spending on skin health, already a INR 14,606 crore category.
Companies pair formulation science with device co-development, evident in insulin pens and auto-injectors. Syrups remain pediatric staples, yet taste-masking tech keeps them competitive against chewable tablets. Novel formats such as thin-film strips pilot in nutraceuticals before larger Rx application, adding another frontier for the India pharmaceutical ������������.

Note: Segment shares of all individual segments available upon report purchase
By Distribution Channel: Digital Layer Redefines Reach
Retail pharmacies, with 75% share, remain the mainstay but face margin squeeze from chain consolidation and Jan Aushadhi generics. Online pharmacies grow 7.30% annually, integrating e-consult, e-lab and last-mile logistics for a one-stop health journey. Hospital pharmacies expand formulary control over specialty biologics, boosting direct procurement volumes.
Wholesalers modernize with WMS and real-time demand analytics to serve omnichannel customers, curbing stock-outs. Regulatory clarity on e-pharmacy, expected by 2026, will dictate channel power balance. Whatever the outcome, a hybrid model seems inevitable for the India pharmaceutical ������������, blending doorstep delivery, click-and-collect and neighborhood chemist counselling.
Competitive Landscape
Roughly 43% of sales rest with the top 10 companies, keeping the field moderately fragmented [3]Sun Pharmaceutical Industries, “Investor Presentation February 2025,�� sunpharma.com. Sun Pharmaceutical leads at 8.2%, leveraging strong dermatology and specialty platforms. Abbott, Cipla, Dr Reddy’s and Lupin round out the front pack with wide branded generic baskets. Multinationals focus on differentiated therapies and patient-assistance schemes to counter generic pricing heat.
Domestic majors invest in complex injectables, respiratory devices and biosimilars to move up the margin ladder. CDMO expansion, especially in high-potency facilities, opens B2B revenue beyond India pharmaceutical ������������ demand. Tech-enabled start-ups bundle telehealth, diagnostics and medicine delivery, forcing incumbents to adopt omnichannel patient-engagement models. Strategic alliances, such as SCHOTT-Serum’s packaging JV and Recipharm-PLG’s regulatory partnership, show how ecosystem players pool hardware and compliance expertise for global ambitions.
White spaces persist in rare-disease therapies, advanced wound-care and precision oncology, areas with limited domestic competition but rising clinical need. Firms with deep specialty focus and export compliant plants can tap premium pricing, mitigating NLEM pressure. Overall, execution hinges on balancing volume-led generic core with innovation-driven specialty bets inside the India pharmaceutical ������������.
India Pharmaceutical Industry Leaders
-
Sun Pharmaceutical Industries Limited
-
Cipla Pharmaceuticals
-
Pfizer
-
Lupin
-
Dr. Reddy’s laboratories
- *Disclaimer: Major Players sorted in no particular order
Need More Details on ������������ Players and Competitors?
Download PDF
Recent Industry Developments
- May 2025: Recipharm entered a strategic partnership with ProductLife Group to speed regulatory clearances and ������������ entry.
- April 2025: Veramed opened Indian headquarters, scaling clinical-research services.
- March 2025: Dr Reddy’s signalled lower appetite for large mergers and will diversify into branded generics and consumer health.
India Pharmaceutical ������������ Report Scope
As per the scope of this report, pharmaceuticals are referred to as prescribed and non-prescribed drugs used for medical purposes to cure, prevent, or control any therapeutic condition. The India Pharmaceutical ������������ is segmented by Therapeutic Category (Anti-Infectives, Cardiovascular, Gastrointestinal, Anti Diabetic, Respiratory, Dermatologicals, Musculo-Skeletal System, Nervous System, and Others) and Drug Type (Prescription Drugs (Branded Drugs and Generic Drugs), and Over Counter Drugs). The report offers the value (in USD million) for the above segments.
| By Therapeutic Category | Anti-Infectives | ||
| Cardiovascular | |||
| Gastrointestinal | |||
| Anti-Diabetic | |||
| Respiratory | |||
| Dermatologicals | |||
| Musculo-Skeletal System | |||
| Central Nervous System | |||
| Oncology | |||
| Others | |||
| By Drug Type | Prescription Drugs | Branded Drugs | |
| Generic Drugs | |||
| OTC Drugs | |||
| By Route of Administration | Oral | ||
| Parenteral | |||
| Topical | |||
| Inhalation | |||
| Others | |||
| By Formulation | Tablets & Capsules | ||
| Injectables | |||
| Syrups & Suspensions | |||
| Ointments & Creams | |||
| Others | |||
| By Distribution Channel | Retail Pharmacies | ||
| Hospital Pharmacies | |||
| Online Pharmacies | |||
| Drug Wholesalers | |||
| By Geography | North India | ||
| South India | |||
| East India | |||
| West India | |||
| Central India | |||
| Northeast India | |||
By Therapeutic Category
| Anti-Infectives |
| Cardiovascular |
| Gastrointestinal |
| Anti-Diabetic |
| Respiratory |
| Dermatologicals |
| Musculo-Skeletal System |
| Central Nervous System |
| Oncology |
| Others |
By Drug Type
| Prescription Drugs | Branded Drugs |
| Generic Drugs | |
| OTC Drugs |
By Route of Administration
| Oral |
| Parenteral |
| Topical |
| Inhalation |
| Others |
By Formulation
| Tablets & Capsules |
| Injectables |
| Syrups & Suspensions |
| Ointments & Creams |
| Others |
By Distribution Channel
| Retail Pharmacies |
| Hospital Pharmacies |
| Online Pharmacies |
| Drug Wholesalers |
By Geography
| North India |
| South India |
| East India |
| West India |
| Central India |
| Northeast India |
Need A Different Region or Segment?
Customize Now
Key Questions Answered in the Report
How big is the India Pharmaceutical ������������?
The India Pharmaceutical ������������ size is expected to reach USD 66.66 billion in 2025 and grow at a CAGR of 5.92% to reach USD 88.86 billion by 2030.
Which therapeutic segment is growing fastest?
Oncology leads growth with a 7.10% CAGR forecast for 2025-2030, outpacing all other categories.
Who are the key players in India Pharmaceutical ������������?
Sun Pharmaceutical Industries Limited, Cipla Pharmaceuticals, Pfizer, Lupin and Dr. Reddy’s laboratories are the major companies operating in the India Pharmaceutical ������������.
What channel is expanding most rapidly?
Online pharmacies grow at a 7.30% CAGR, the highest among distribution channels, driven by convenience and digital adoption.

